Source: EDB, Singstat
Quick Infographics: Manufacturing Output

Source: EDB, Singstat

Source: EDB, Singstat
Quick Infographics
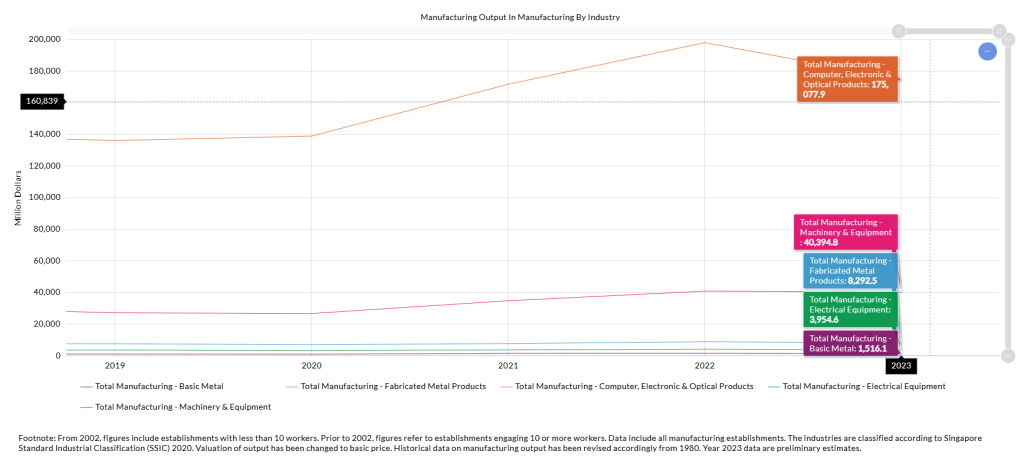
This chart showcases Singapore’s total manufacturing output by major industry segments from 2019 to 2023. The computer, electronics, and optical products segment stands out with a robust upward trajectory from 136k million dollars in 2019 to a peak of nearly 180k million in 2022, before a slight easing in 2023. Meanwhile, machinery & equipment posted growth from 27k million to 40k million, reflecting strong capital investment trends. Basic metals remain relatively smaller in scale, with output rising modestly from 1,249 to ~1,516 million over the same period. The fabricated metal products segment also gradually strengthened, surpassing 7,721 million in 2019 to over 8,292 million by 2023. Electrical equipment, though more moderate, maintains steady performance. Notably, post-2002 data includes establishments with fewer than 10 workers, broadening coverage. Historical figures were revised to ensure consistency with Singapore’s Standard Industrial Classification (SSIC) 2020. Year 2023 data remains preliminary as indicated by current estimates.