Source: EDB/ Singstat/ Table Builder
Quick Infographics: Business Expectations of The Manufacturing Sector

Source: EDB/ Singstat/ Table Builder
Quick Infographics Tips
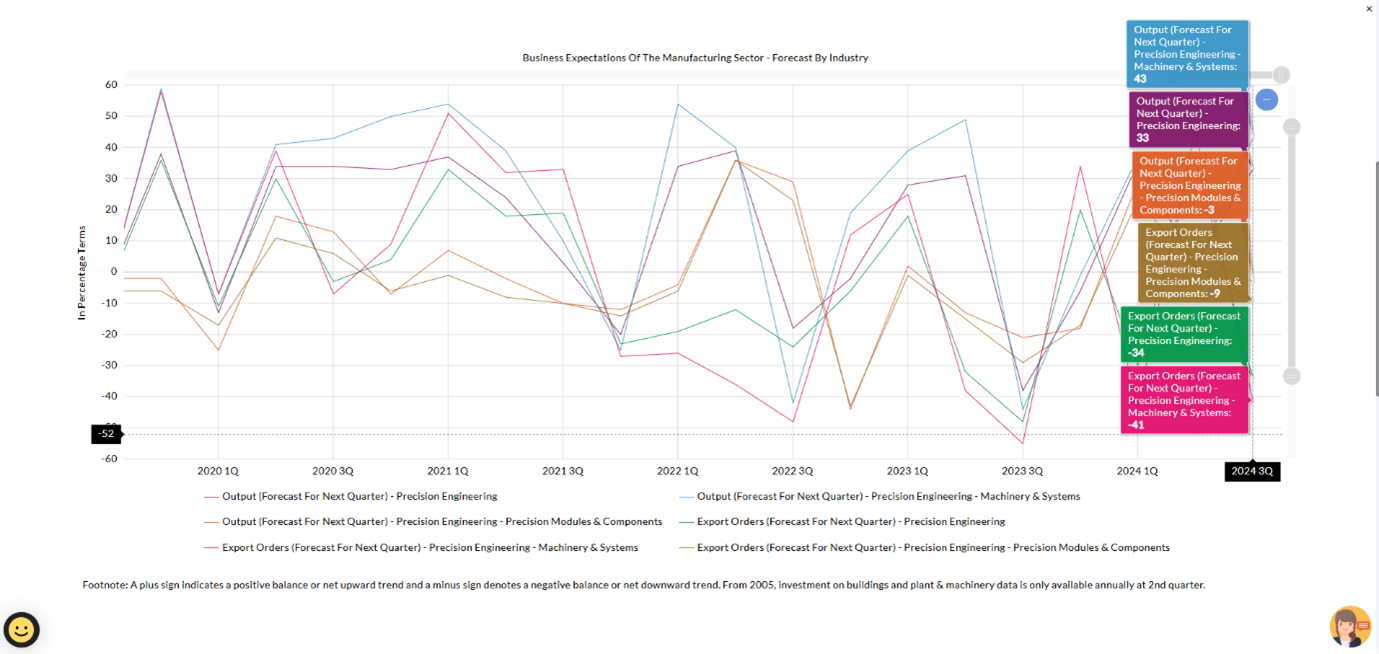
This chart depicts Singapore’s manufacturing sector, focusing specifically on the Precision Engineering cluster, subdivided into key segments such as Machinery & Systems and Modules & Components. The lines represent each segment’s forecast for output and export orders for the next quarter over various time periods from 2020 to 2024. Observably, after a sharp dip in early 2020, reflecting the pandemic’s initial shocks, the indices show cyclical swings corresponding to evolving economic conditions. Notably, there are distinct peaks in mid-2021 and early 2022, indicating periods of optimism for demand and production. Conversely, export order fluctuations highlight vulnerabilities to global trade dynamics. A plus sign signals a positive balance or net upward trend, while negative values illustrate contractions. Overall, these insights offer a snapshot of business sentiment, aligning with broader recovery patterns and cautionary signals as firms navigate global uncertainties. Data on building and machinery investments are reported annually starting 2005 only.